
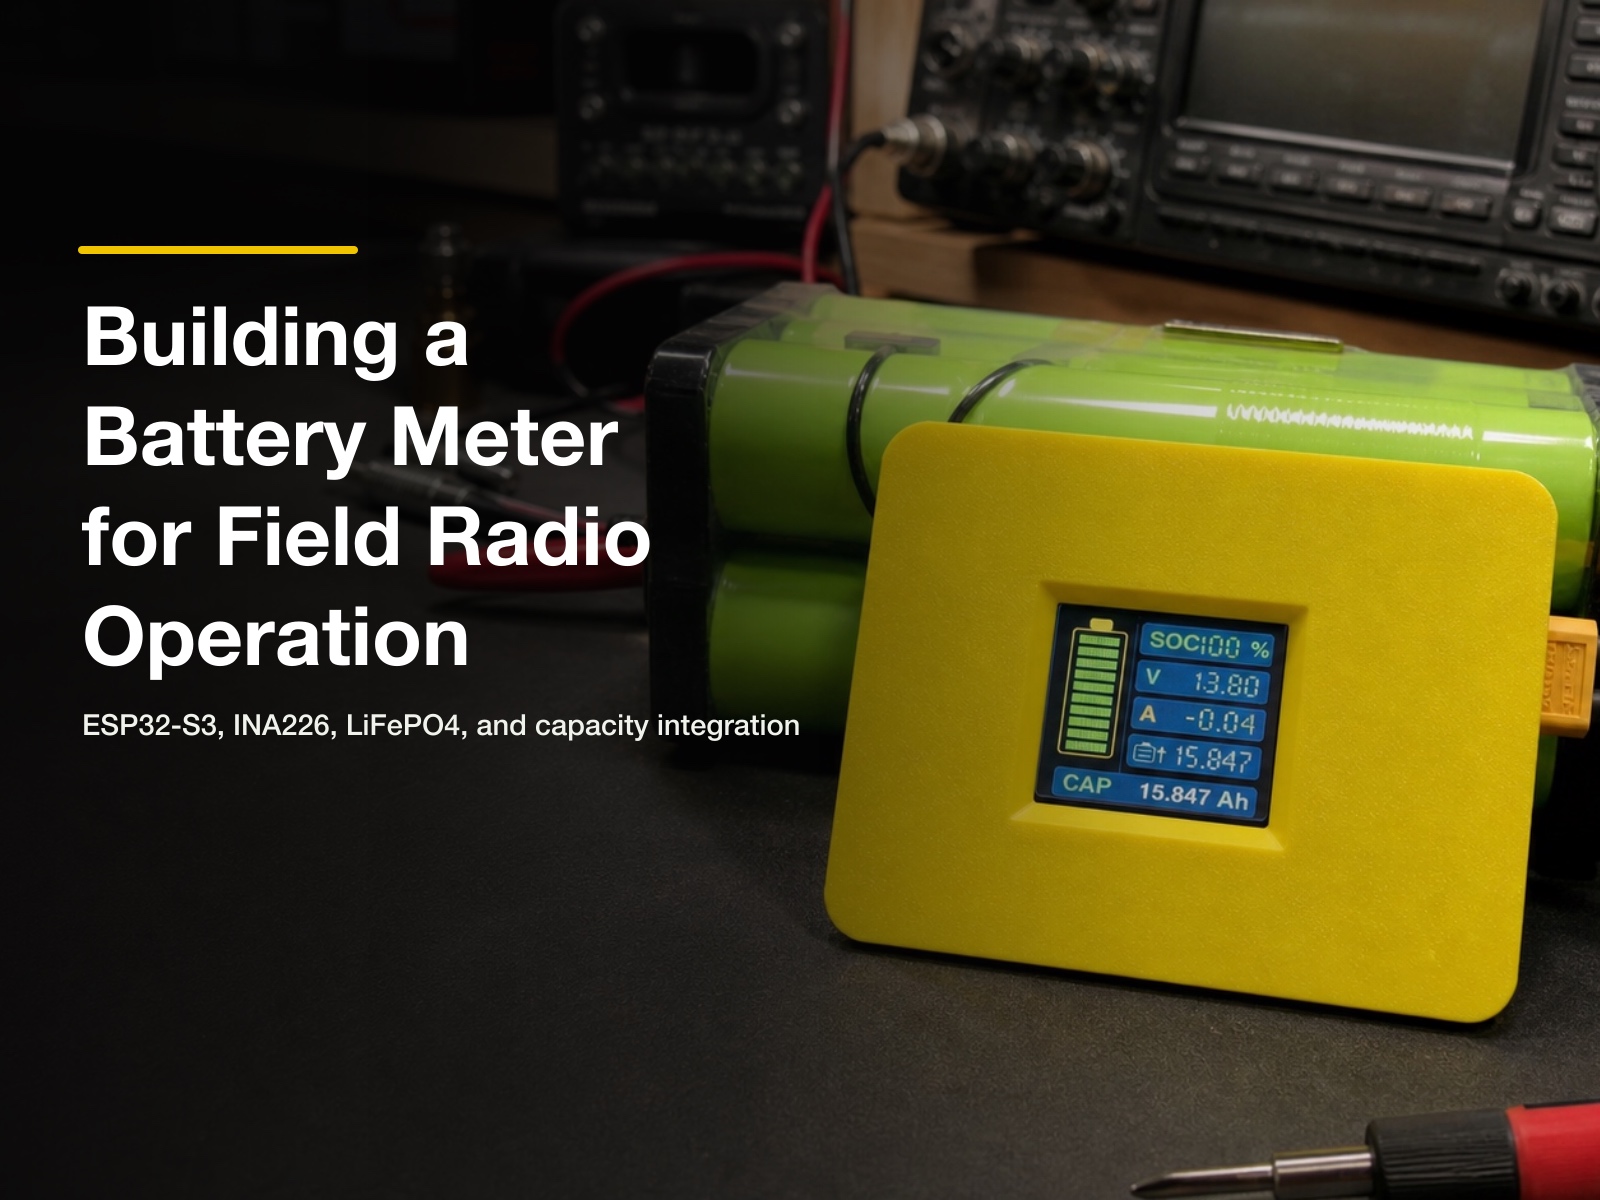
When doing the field radio operation, the battery is always one of the things I care about most.
For a small QRP station, the power problem is usually not very difficult. The current is low, and a modest battery could last for a long time.
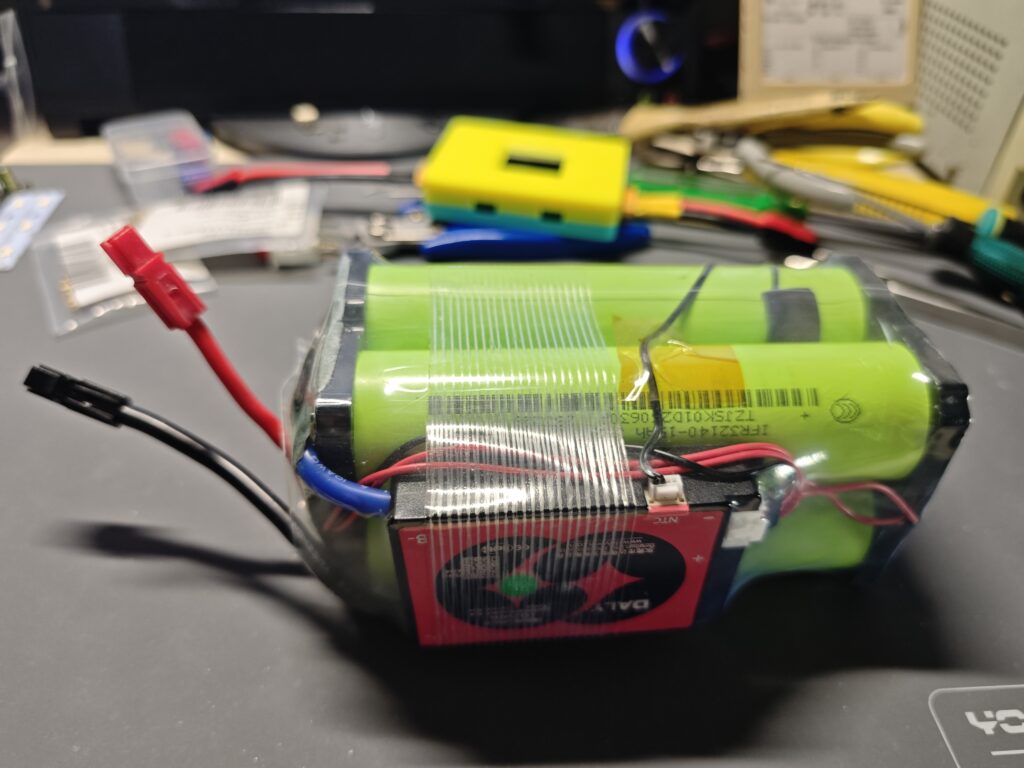
But I do not always run QRP. Sometimes I want to bring a full-power HF radio, for example a 100 W transceiver, and power it from a 4-cell LiFePO4 battery pack. Four LiFePO4 cells are a practical match for radio use. The voltage is usually around 13 to 14.4 V, which is within the safe workinng voltage of many HF radios.
The problem is that I do not want to guess how much battery is left.
A voltmeter is useful, but it is not enough. LiFePO4 voltage can stay flat for a long time, then fall faster near the end. So the voltage may look fine, but the usable energy inside the battery may already be much lower than I think.
For field operation, I want to know more practical things:
- How much current is the radio drawing now?
- How much power is being used?
- How much capacity has already been consumed?
- How much capacity may still be left?
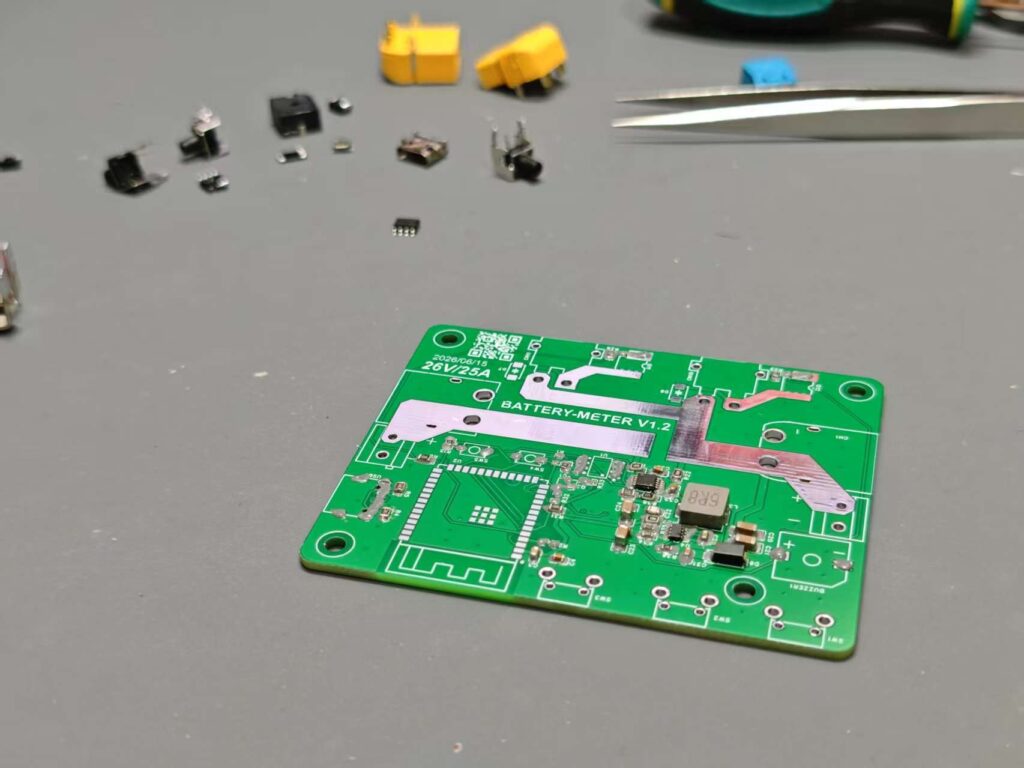
So I have the battery meter project. This project is now a real hardware build. It has a schematic, PCB, assembled board, enclosure, firmware, TFT screen, FRAM storage, BLE telemetry, and a Flutter companion app. This article is about the design, but more importantly, it is about the idea behind the meter: measuring current over time.
What the meter measures
The meter is designed to be installed inline between the battery and the radio or load. The purpose is simple: measure voltage and current continuously, then calculate some useful values from the measurements.
These values include:
- power
- consumed capacity
- remaining capacity
- battery percentage
- load output state
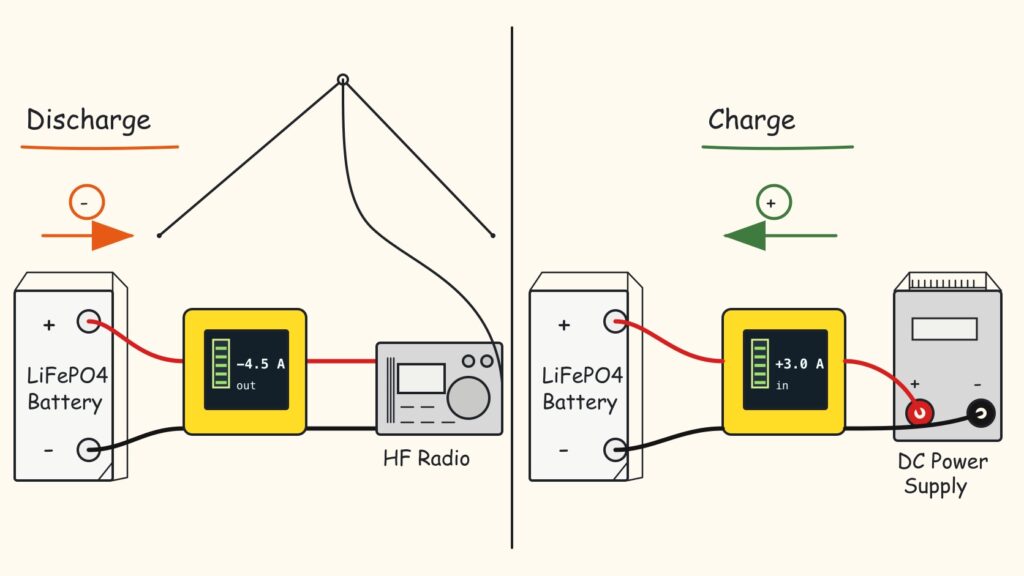
In my firmware, discharge current is shown as negative current. Charging current is positive, which is a little different from some commercial meters. But for this project, it makes sense to me. When the radio is using the battery, current leaves the battery pack and goes to the radio or load, so I count it as negative. When the battery is being charged, current goes from the charger into the battery, so I count it as positive.
Hardware concept
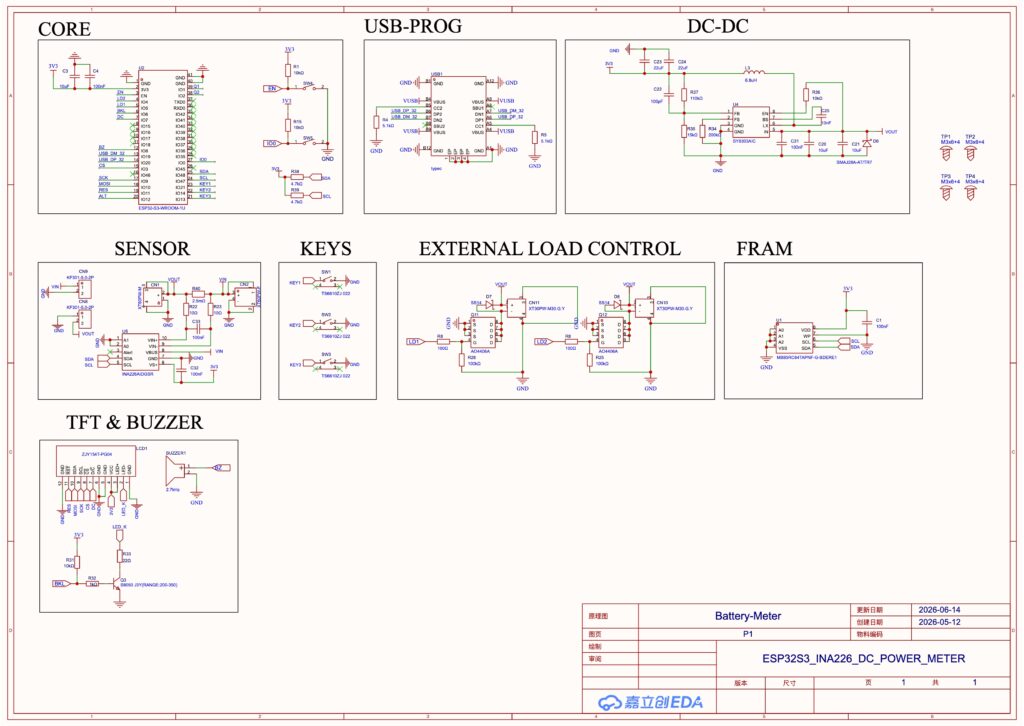
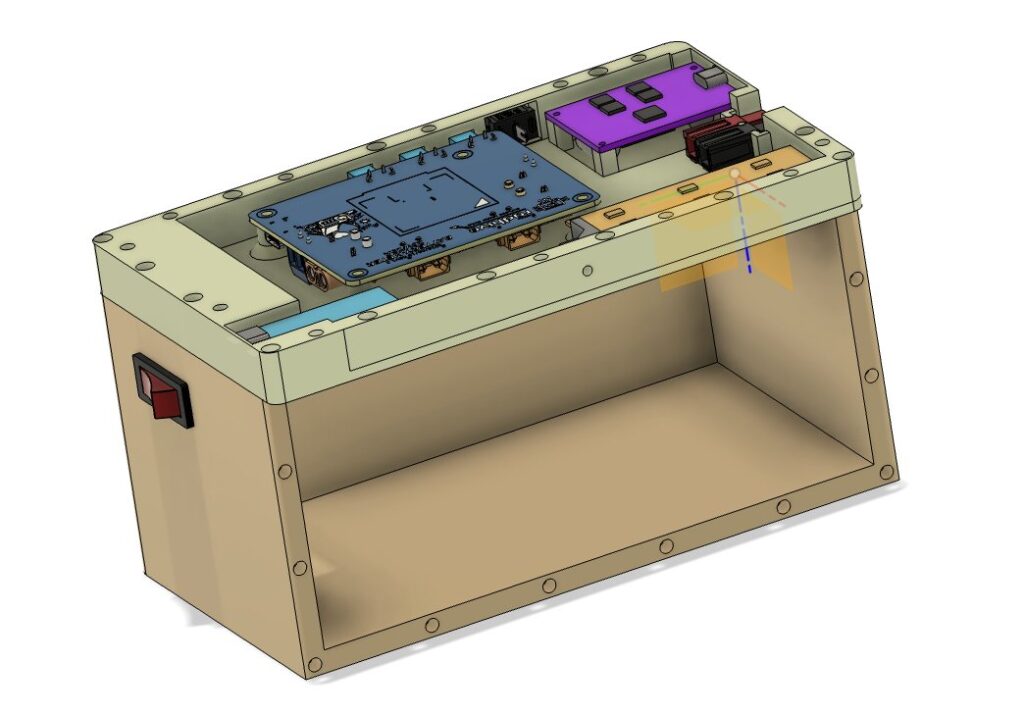
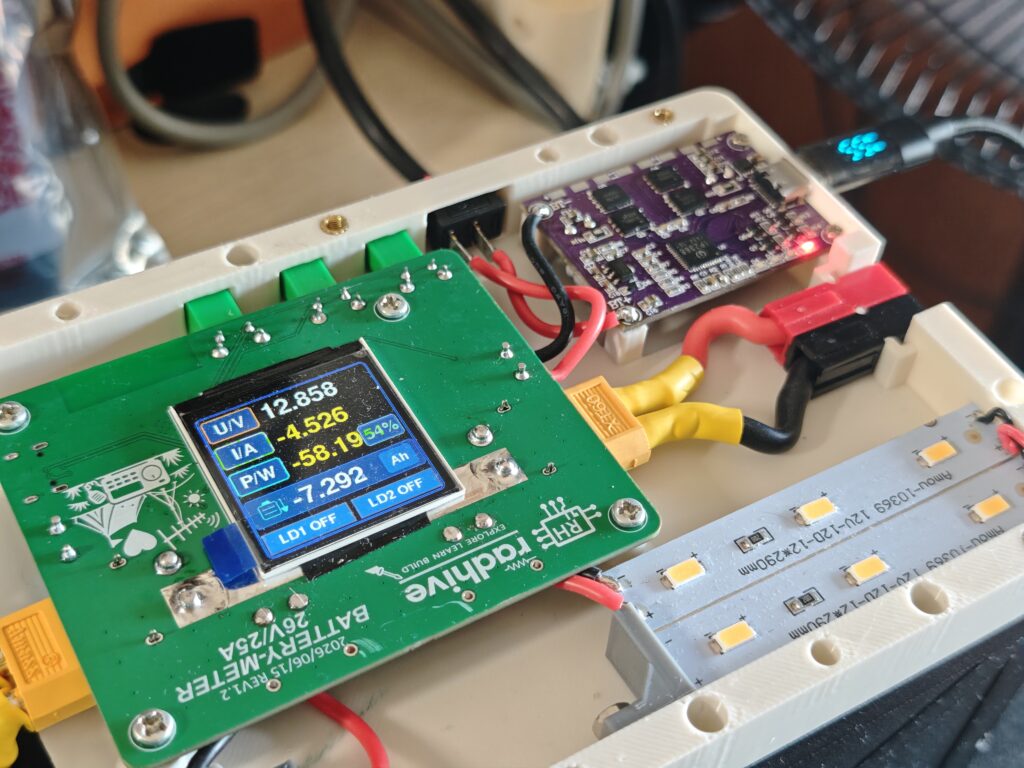
The hardware is not so exotic. The main controller is an ESP32-S3 module. It talks to an INA226 current and voltage monitor over I2C.
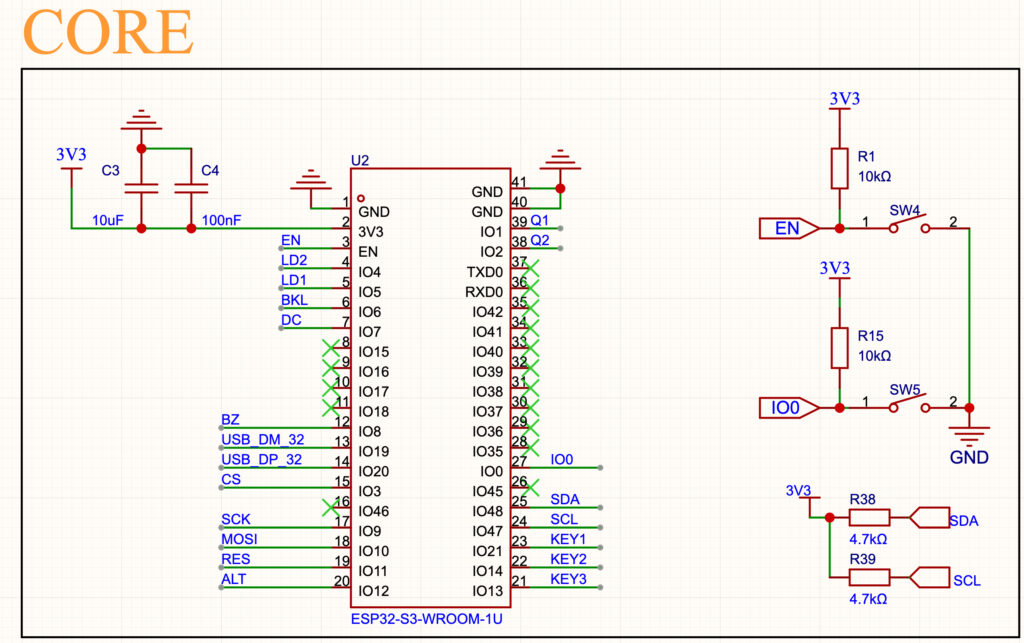
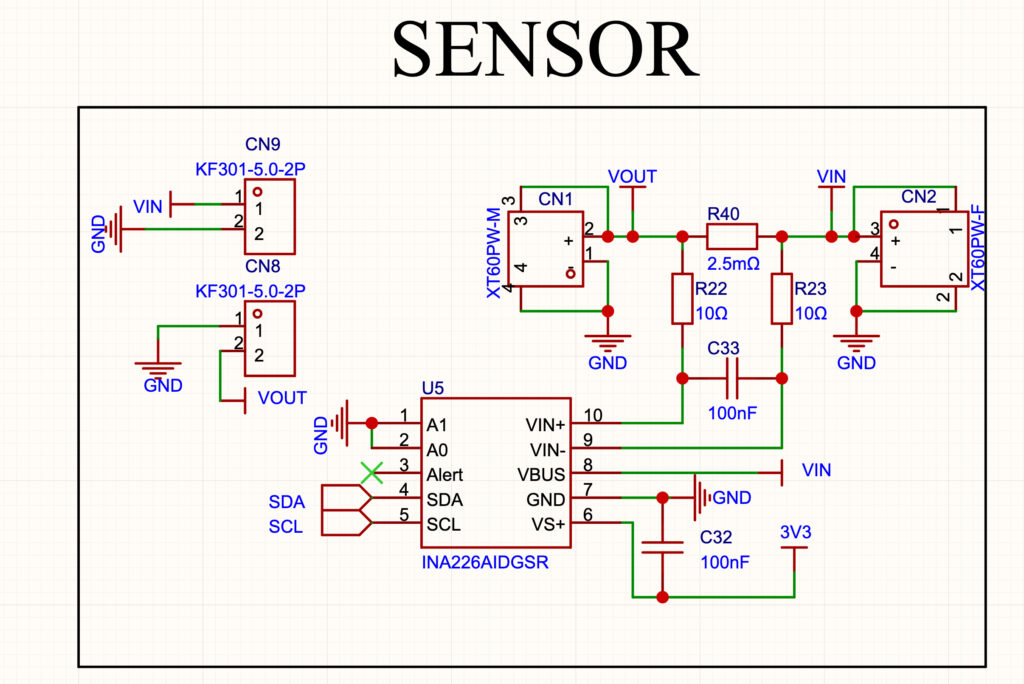
At 25 A, the shunt voltage is:
25 A * 0.0025 ohm = 0.0625 VSo the shunt voltage is about 62.5 mV.
The heat in the shunt is:
P = I^2 * R = 25^2 * 0.0025 = 1.56 WThis number matters. Current measurement like this is not only a software problem. The shunt, copper width, connector choice, Kelvin routing, and heat all matter. If these parts are wrong, the values shown on the display will not be very meaningful.
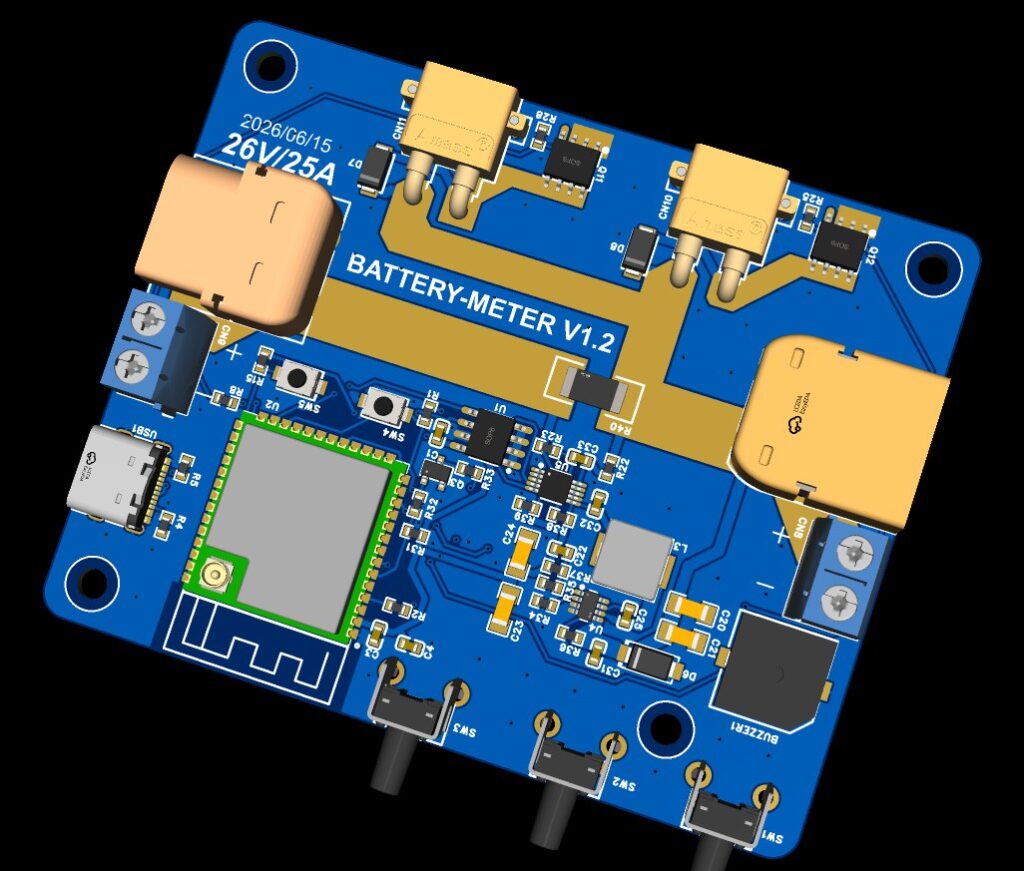
Here are the main parts:
- ESP32-S3-WROOM module
- INA226 current and voltage monitor
- 2.5 milliohm current shunt
- MB85RC64T I2C FRAM
- 1.54 inch SPI TFT display
- three buttons
- two controllable XT30 auxiliary outputs
- buzzer for alert feedback
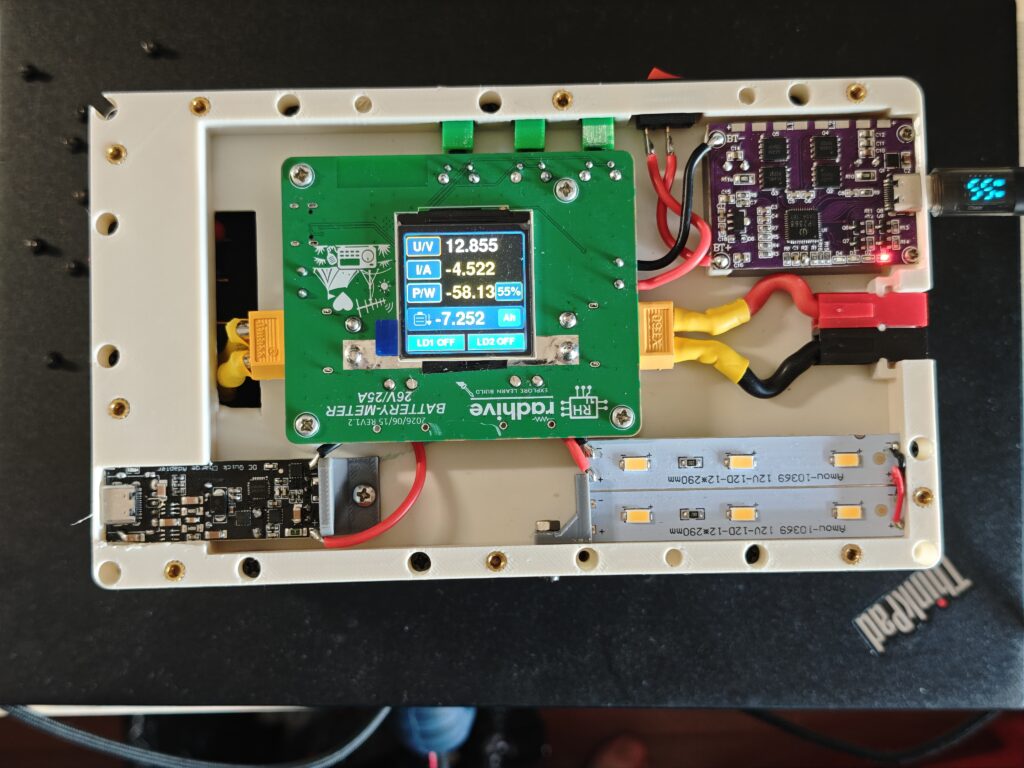
The two XT30 outputs are for small accessories. For example, I could power a USB quick-charge module from the same battery pack. These outputs are switched by MOSFETs, and their ON/OFF states are shown on the display.
Why a FRAM
One important change in this project was adding FRAM. At first, I thought about saving the latest capacity value to ESP32 flash quickly when power was going away. That sounds possible theoretically. But, in my previous design, I got some problems. When the battery plug is pulled, the ESP32 may only have a very short time before it loses power. It may not have enough time to save data safely. Meanwhile, flash also does not like being written too often.
Instead of adding a huge capacitor to prolong the power-down window for saving critical data to flash, I used an MB85RC64T I2C FRAM. FRAM is useful here because it can be written quickly and often. The firmware does not need to wait for the last moment. We can save the important values while the meter is running.
The storage scheme is simple:
- Keep live values in RAM.
- Save a compact record to FRAM about once per second.
- Save immediately when important settings change.
- Use two alternating record slots.
- Store a magic value, version, sequence number, payload, and CRC.
- On boot, read both records and use the newest valid one.
With this scheme, it makes the meter feel more like field equipment. If power is suddenly removed, I may lose the last second of capacity data. But I should not lose the whole session.
Firmware structure
The firmware is written with the ESP32 Arduino framework under PlatformIO. I kept the code Arduino-style on purpose. This project is meant to be debugged on real hardware, so I wanted the code to stay easy to follow. The firmware is split into several parts:
ina226: sensor setup and live readsmeasurement: measurement and integration taskstorage: FRAM records, CRC, restore, and savedisplay: TFT UI with Adafruit ST7789 and an off-screen canvascontrols: buttons, debounce, menu, and load togglesble_telemetry: BLE telemetry and commandsfirmware_update: Wi-Fi and web OTA update paths
One important thing is that the measurement is faster than the display. The firmware samples and integrates current around every 10 ms. The TFT display refresh is slower. This way the measurement can keep working in the background, and the display does not need to flicker or update too often.
The key algorithm: integration
Battery capacity is usually described in ampere-hours.
If a load draws 1 A for 1 hour, that says:
1 A * 1 h = 1 AhIf a load draws 10 A for 0.5 hours, that says:
10 A * 0.5 h = 5 AhBut a radio does not draw constant current. In receiving, the current may be low. When transmitting, the current drawing may be much higher. The display, fan, audio, tuner, and accessories could all change the total amount of load value too. So the meter cannot just measure current one time and multiply it by the whole operating time.
The line-art pictures in this section are AI-generated illustrations. I use them here only to make the context and current flow easier to understand.
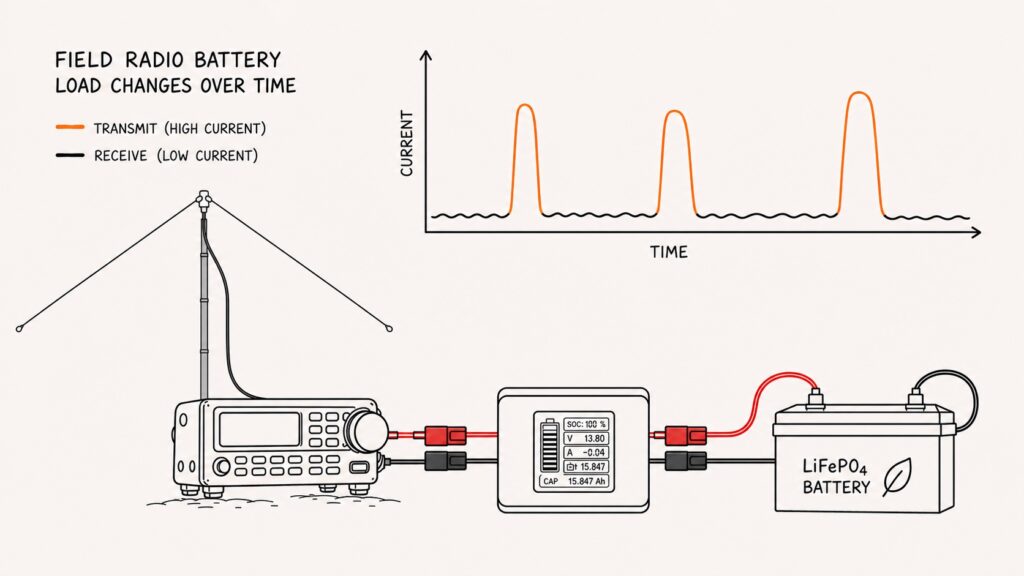
It has to add up many small pieces. In simple words:
capacity change = current * elapsed time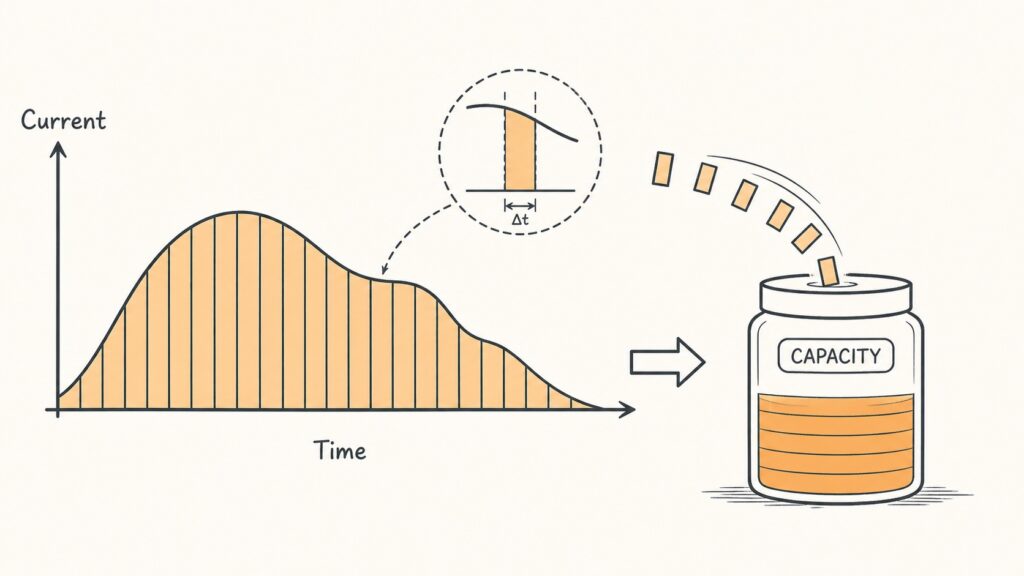
The firmware reads the current again and again. For each measured current sample, it checks how much time has passed since the previous sample. Then it adds that small amount to a signed capacity counter.
This is important because my current direction has a sign. In this project, discharge current is negative and charge current is positive. So during discharge, the integrated value moves negative. If I want to show “used capacity” as a positive number, I can display the negative of the discharge value, or count discharge separately.
Below is the important part of the code:
integrationRemainder += (int64_t)currentMa * (int64_t)elapsedUs;
signedCapacityUah += integrationRemainder / 3600000LL;
integrationRemainder %= 3600000LL;
The code uses mA, microseconds, and microamp-hours. The number 3600000 comes from the conversion:
mA * us / 3,600,000 = uAhWhy this number? Because 1 mA is 1000 uA. One hour is 3,600,000,000 microseconds. So:
uAh = mA * 1000 * us / 3,600,000,000
uAh = mA * us / 3,600,000
The variable integrationRemainder is important. If the firmware drops the fractional part every time, the small errors could slowly add up. So it keeps the remainder and carries it into the next sample. Also, the loop does not assume every sample is exactly 10 ms apart. It uses function micros() to measure the real elapsed time. This matters because I2C reads, RTOS scheduling, and other tasks could introduce small timing changes. So the basic idea is:
signed capacity change = sum of each current sample multiplied by its real elapsed timeThat is the part that turns a current sensor into a simple battery fuel gauge.
First-use calibration
The meter needs to know the battery’s usable capacity before it can estimate remaining capacity. The label on the battery pack may say 15 Ah, or 12 Ah, or another number. But the real usable capacity depends on the cells, age, temperature, discharge current, and cutoff voltage. So the first-use calibration idea is:
- Start with a fully charged battery. It should not be charged through the battery meter during this step.
- Connect the meter and a known load, for example, a high power resistor, 10 ohms or lower, depending on your battery’s output voltage.
- Connect the battery meter to your battery, then connect your load to the battery meter, and discharge it down to the cutoff voltage.
- The meter counts the consumed capacity while the battery is being discharged.
- The meter stores the measured consumed capacity as the usable battery capacity.
After that, things become simple in normal operation:
remaining capacity of your battery = measured battery capacity - consumed capacityHere, consumed capacity means a positive used amount. It is still an estimate. It is not magic. But it is more useful than only watching voltage.
User interface
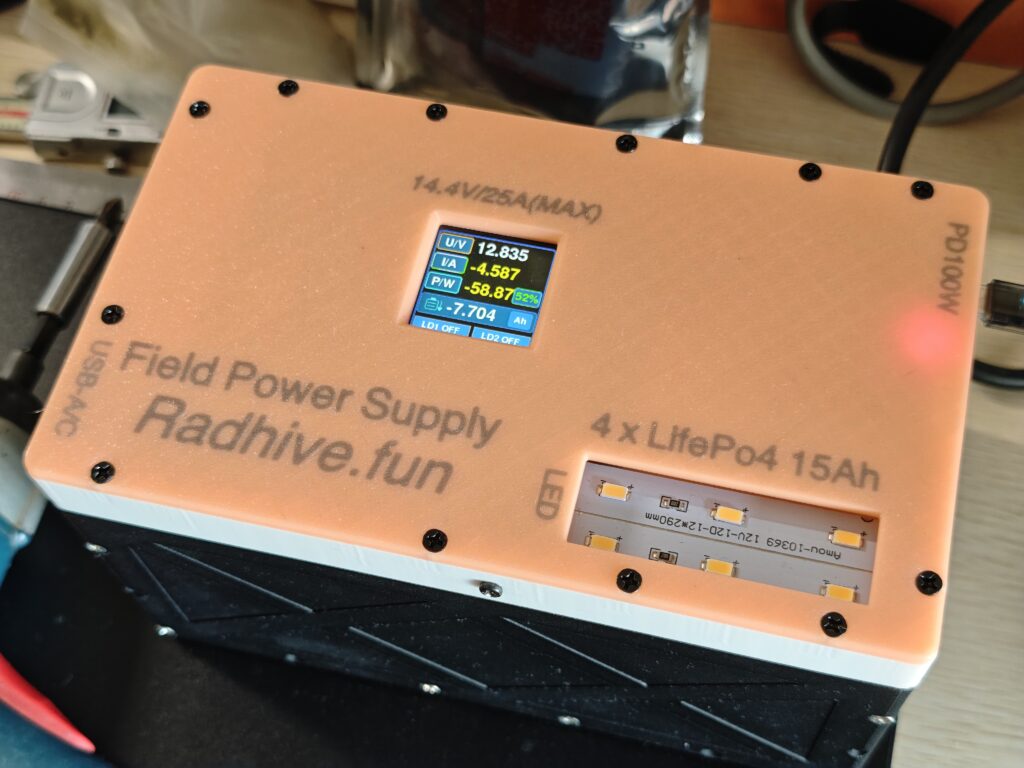
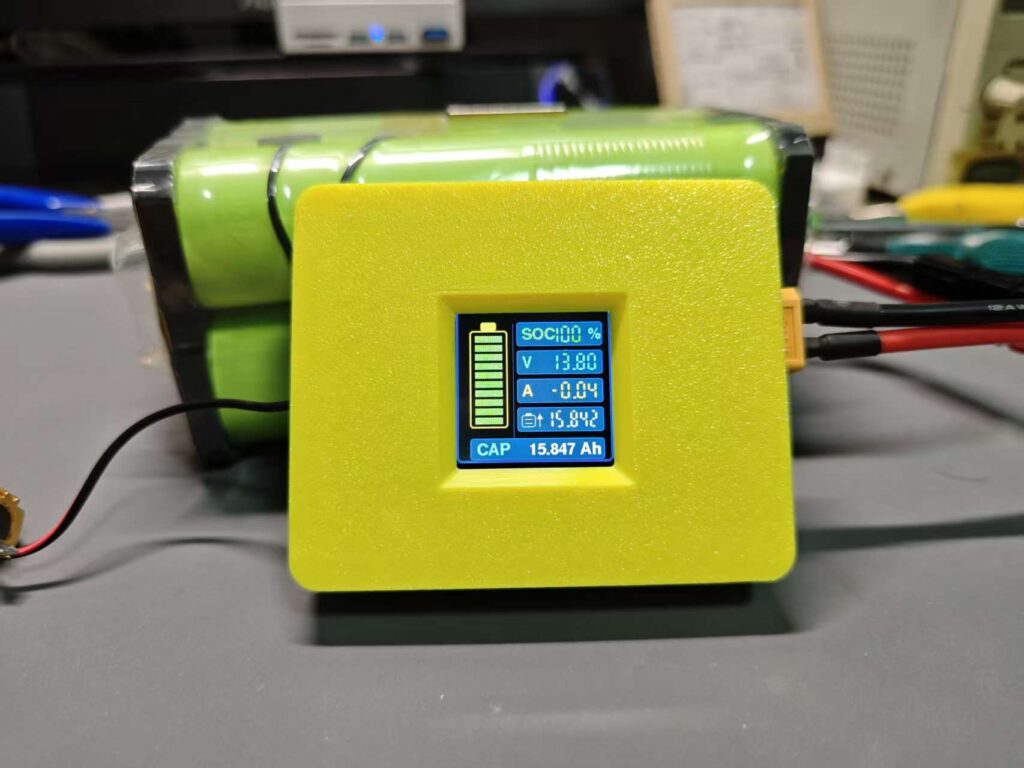
The meter uses a small 1.54 inch SPI TFT. I wanted the UI to feel like a small field instrument. The main screen shows voltage, current, power, capacity, battery percentage, and LD1/LD2 output state.
There is also a battery-gauge page for a quicker view. The three buttons are used like this:
- KEY1: up / increase / toggle LD1 in normal mode
- KEY2: down / decrease / toggle LD2 in normal mode
- KEY3: page / set / long-press settings
The settings menu includes capacity, thresholds, buzzer, BLE, display rotation, Wi-Fi status, firmware OTA, web OTA, and reset-used functions.
BLE and companion app
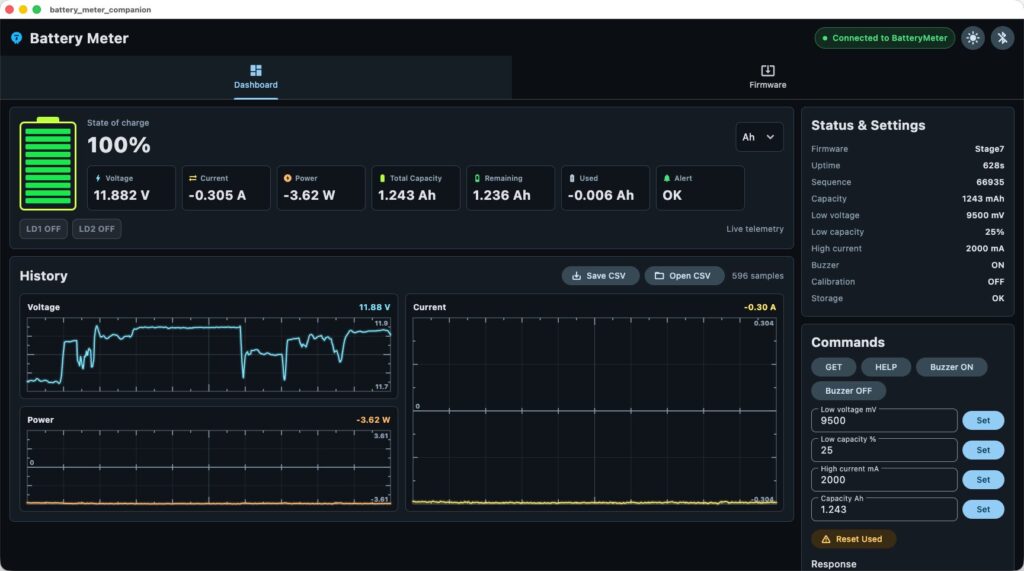
The project also has a PC companion app built from Flutter. The meter advertises over BLE as BatteryMeter. The app can connect to it, show live telemetry, draw voltage/current/power history, save CSV logs, and send settings commands.
For field use, the TFT is still the main display. It is always there, and it does not need another device. But for bench testing and logging, the app is very useful. A larger screen makes it easier to see history and check settings. The BLE telemetry includes:
- voltage
- current
- power
- state of charge
- used capacity
- remaining capacity
- total capacity
- LD1/LD2 state
- alert status
The app also helps with development. It can send Wi-Fi settings over BLE and help configure OTA update sources.
Firmware updates
Because the meter may be mounted inside a box, or on one side of the battery pack, I do not want every firmware update to require a USB cable.
So the firmware has two Wi-Fi update paths:
- Download a firmware binary directly from a configured online URL.
- Start a small web server on the meter and upload
firmware.binfrom a browser.
The web OTA page shows upload progress and status.
The firmware also reports update errors, for example a wrong file type, not enough update space, or reset causes. This is where the use of ESP32-S3 really matters. My board uses an ESP32-S3 N16/R8 module. So the PlatformIO build and partition table need to match 16 MB flash and 8 MB PSRAM. The project now uses a custom 16 MB partition table with two 6 MB OTA slots.
Conclusion
This project started from a simple field question:
How much battery does it still have?
A voltage display can only give part of the answer. For a LiFePO4 pack, especially when running a radio, I want to know more parameters, not just voltage. I need a device that can show me the live parameters, for example, current, power, used capacity, and remaining capacity. This battery meter is my attempt to make those information visible, so I do not need to guess from voltage alone.
For me, that is the value of this small instrument. It does not make the battery larger. It just makes the battery easier to understand.